Data Science is an interdisciplinary field wherein studies are conducted using the data available. Data Scientists extract important information, knowledge, methods and more from different types of data. These days Data Science is gaining a lot of importance given how our world is being driven by data and different digital formats. Many people aspire to be data scientists and recruitment process of companies is very tough given the competition in the field. Interview is a very important round of the recruitment procedure.

Source: Safalta.com
Here we have provided top 100 data science interview questions for to practice.
What is Data Science?
Data science includes various disciplines, including statistics, arithmetic, specialised software, artificial intelligence, machine learning, etc. In order to extract information from data utilised in strategic planning, decision-making, etc., data scientists simply apply particular concepts and analytical tools. Analyzing data for useful insights is the essence of data science.
Interview questions for basic and advanced data science
1. What distinguishes supervised from unsupervised learning?
|
Supervised Learning |
Unsupervised Learning |
|---|---|
|
|
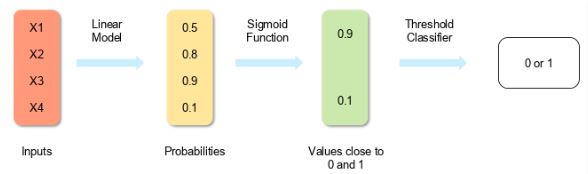
2. What is the process of logistic regression?
By estimating probability using its underlying logistic function, logistic regression analyses the relationship between the dependent variable (our label for what we want to predict) and one or more independent variables (our features) (sigmoid).
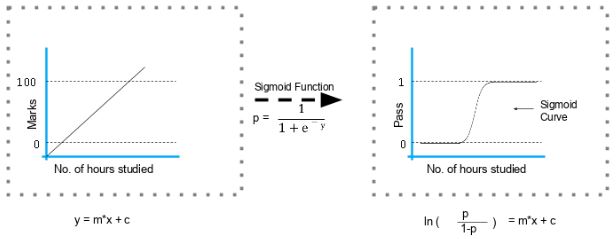
The following illustration shows how logistic regression functions:
The sigmoid function's formula and graph are as follows:
3. Describe how to create a decision tree.
Use the complete collection of data as your input.
Determine the entropy of the target variable and the characteristics of the predictors.
Do the math to determine your information gain for all qualities (we gain information on sorting different objects from each other)
As the root node, pick the property with the greatest information gain.
until each branch's decision node is reached, carry out the same steps on each branch.
4. How is a random forest model created?
Many different decision trees are used to create a random forest. The random forest puts all the trees together if the data is divided into many packages and a decision tree is created for each package of data.
How to construct a random forest model:
Choose 'k' features at random from a total of'm' features where k m
Calculate node D using the best split point among the "k" characteristics.
Utilize the optimum split to divide the node into daughter nodes.
In order to complete the leaf nodes, repeat steps two and three.
Create a forest by repeating steps one through four n times to produce n trees.
5. How do you prevent your model from becoming overfitting?
A model that is overfitted ignores the wider picture and is only tuned for a relatively tiny quantity of data. To prevent overfitting, there are three basic strategies:
Keep the model straightforward by considering fewer variables, which will help to reduce some of the noise in the training data.
Utilize cross-validation methods, such as the k-folds method.
If you want to avoid overfitting, employ regularisation techniques like LASSO that penalise specific model parameters.
6. Explain the differences between single-, bi-, and multivariate analyses.
Univariate
Only one variable is present in univariate data. The univariate analysis's goals are to explain the data and identify any patterns in it.
Bivariate
Two distinct variables are present in bivariate data. This sort of data analysis examines linkages and causes, and it seeks to understand the causal connection between the two variables.
Multivariate
Three or more variables must be present for data to be considered multivariate. It resembles a bivariate but has more dependent variables than a bivariate.
7. What feature selection techniques are utilised to pick the appropriate variables?
The filter approach and the wrapper method are the two basic feature selection techniques.
Filter Techniques
This entails:
Analysis of linear discrimination
ANOVA
Chi-Square
When we're limiting or picking the features, it's all about cleaning up the data coming in. The greatest analogy for selecting features is "poor data in, lousy answer out."
Wrapper Techniques
This entails:
Forward Selection: Until we find a good fit, we test each feature separately and keep adding them.
Testing every feature, we begin to remove some of them to find what functions best.
Recursively examines all the features and how they interact with one another to eliminate features.
Wrapper methods require a lot of manual labour, and powerful computers are required if extensive data processing is done using the wrapper approach.
8. Write software that outputs the numbers from 1 to 50 in the language of your choice.
Print "Fizz" instead of the number for multiples of three, and "Buzz" for multiples of five. Print "FizzBuzz" for values that are multiples of both 3 and 5.
As demonstrated in the code below:
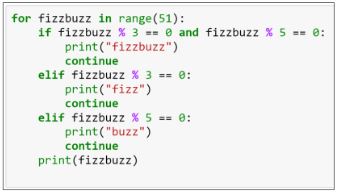
Keep in mind that the range is 51, which equals 0 to 50. However, the question only specifies a range of 1 to 50. As a result, you can include the range as in the code above (1,51).
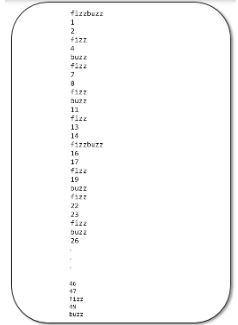
The output of the code above looks like this:
9. A data collection containing variables with more than 30% of their values missing is handed to you. How are you going to handle them?
How to manage missing data values includes the following:
We can easily delete the rows with missing data values if the data set is huge. We use the remaining data to forecast the values, making it the quickest method.
Using the panda's data frame in Python, we may replace missing values with the mean or average of the remaining data for smaller data sets. There are other methods for doing this, including df.mean() and df.fillna (mean).
10. How will you use Python to determine the Euclidean distance between the provided points?
plot1 = [1,3]
plot2 = [2,5]
Calculating the Euclidean distance is as follows:
Euclidean distance is calculated as sqrt((plot1[0]-plot2[0])**2 + (plot1[1]-plot2[1])**2).
11. What are the advantages of dimensionality reduction?
To communicate the same information succinctly, a data collection with several dimensions is reduced in size using a technique known as "dimensionality reduction."
This decrease aids in data compression and storage space reduction. Additionally, because there are fewer dimensions, there is a reduction in computation time. It eliminates features that are unnecessary; for instance, holding a value in two separate units serves no purpose (meters and inches).
12. How should the following 3x3 matrix's eigenvalues and eigenvectors be calculated?
|
-2 |
-4 |
2 |
|
-2 |
1 |
2 |
|
4 |
2 |
5 |
13. How should a deployed model be maintained?
The actions to keep a deployed model up to date are:
Monitor
To assess the performance accuracy of all models, ongoing monitoring is necessary. Knowing how your modifications will impact things is important while making adjustments. This needs to be watched to make sure it's carrying out its intended function.
Evaluate
To ascertain whether a new algorithm is required, evaluation metrics for the existing model are computed.
Compare
To ascertain which model performs the best, the new models are contrasted with one another.
Rebuild
On the basis of the most recent data, the best-performing model is rebuilt.
14. Recommender systems: What are they?
Based on user preferences, a recommender system predicts how a user will evaluate a certain product. It can be divided into two sections:
Teamwork in Filtering
For instance, Last.fm suggests songs based on what other users who share your interests frequently listen to. Customers may get the following message along with product recommendations after completing a purchase on Amazon: "Users who bought this also bought..."
Filtering based on content
As an illustration, Pandora uses a song's characteristics to suggest songs with related characteristics. Instead of focusing on who else is listening to music, we are here focusing on the substance.
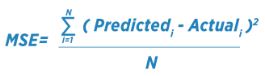
15. A linear regression model's RMSE and MSE can be found in what way?
A linear regression model's accuracy can be measured using RMSE and MSE, two of the most popular metrics.
Root Mean Square Error is denoted by the acronym RMSE.
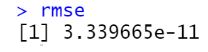
The Mean Square Error (MSE) is referred to.
16. How do you choose k for the k-means?
In order to choose k for k-means clustering, we employ the elbow approach. The elbow technique works by applying the k-means clustering algorithm on the data set, where k is the number of clusters.
It is referred to as the sum of the squared distances between each cluster member and its centroid in the sum of squares (WSS) formula.
17. What role does the p-value play?
usually a p-value of 0.05
You reject the null hypothesis because of the significant evidence presented here.
usually > 0.05 for p-value
You accept the null hypothesis since there is scant evidence to support it.
0.05 as the cutoff p-value
As it might go either way, this is thought to be marginal.
18. How should anomalous values be handled?
Outliers can only be dropped if the value is garbage.
Example: Adult height = ABC ft. Since the height cannot be a string value, this statement is false. Outliers in this situation can be eliminated.
The outliers can be eliminated if their values are excessive. For instance, if all of the data points are grouped between zero and ten, but one point is at one hundred, we can eliminate it.
If you are unable to eliminate outliers, try the following:
- Change up your model. Nonlinear models can be used to fit data that linear methods have identified as outliers. Therefore, be certain that the model you select is the right one.
- Attempt to normalise the data. The extreme data points are brought into a similar range in this way.
- You can utilise methods that are less impacted by outliers; random forests are one such example.
19. How is time-series data certified to be paper?
When the variance and mean of the series remain constant across time, it is stationary.
Here's an illustration to help:
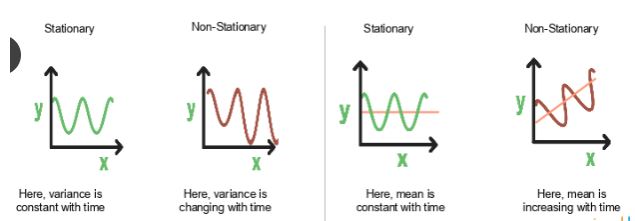
The variance in the first graph doesn't change over time. In this case, Y is the variable and X is the time factor. Y's value is stationary since it always passes through the same locations.
20. How is accuracy determined using a confusion matrix?
Take a look at this matrix of confusion:
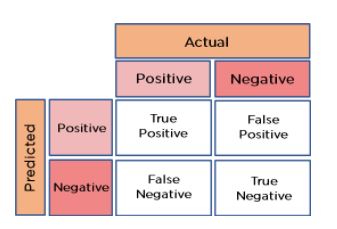
The total data values, actual values, and anticipated values are all visible.
The accuracy equation is:
Observations total / (True Positive + True Negative) = Accuracy
= (262 + 347) / 650
= 609 / 650
= 0.93
We, therefore, obtain an accuracy of 93%.
21. Calculate the precision and recall rate using the equation that is written.
Think about the confusion matrix mentioned in the preceding query.
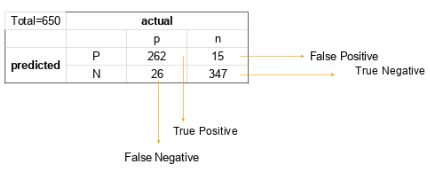
Precision is calculated as (True positive) / (True Positive + False Positive).
= 262 / 277
= 0.94
Recall Rate equals the ratio of true positives to total positives plus false negatives.
= 262 / 288
= 0.90
22. Which algorithm produces the "People who bought this also bought..." suggestions on Amazon?
Collaborative filtering is used to power the recommendation engine. The use of collaborative filtering reveals how consumers behave and their past purchases in terms of ratings, selection, etc.
Based on the preferences of other users, the engine predicts what would interest a person. The item features in this algorithm are unknown.
23. Create a simple SQL query that lists all orders together with the customers' details.
In our typical order tables and customer tables, the following columns are present:
Order Table
Orderid
customerId
OrderNumber
TotalAmount
Customer Table
Id
FirstName
LastName
City
Country
The SQL query is:
SELECT OrderNumber, TotalAmount, FirstName, LastName, City, Country
FROM Order
JOIN Customer
ON Order.CustomerId = Customer.Id
24. You receive a dataset on the detection of cancer. You constructed a classification model and attained a 96 per cent accuracy. Why shouldn't your model's performance make you happy? What can you do to change it?
Data imbalances are a result of cancer detection. Accuracy should not be used as a performance indicator in an unbalanced dataset. The patients with incorrect diagnoses make up the remaining 4%, which need special attention. Early detection of cancer is essential because it can significantly enhance a patient's prognosis.
Therefore, to assess the effectiveness of the model, we need to use the Sensitivity (True Positive Rate), Specificity (True Negative Rate), and F measures to assess the class-specific performance of the classifier.
25. Which of the following machine learning algorithms may be used to enter missing values for both continuous and categorical variables?
K-means grouping
linear regressive
K-NN (k-nearest neighbour)
a decision tree
Because the K closest neighbour algorithm can compute the nearest neighbour and only computes the nearest neighbour based on the other features if the nearest neighbour has no value, it can be employed.
You must include that in your pre-processing when using linear regression or K-means clustering; otherwise, they will crash. Despite certain differences, decision trees share the same issue.
26. The target variable's eight actual values from the training file are listed below. What is the target variable's entropy?
[0, 0, 0, 1, 1, 1, 1, 1]
Select the right response.
((3/8 log(3/8) + 5/8 log(5/8))
3/8 log(3/8) + 5/8 log(5/8)
5/8 log(3/8) + 3/8 log(5/8)
3/8 log(5/8), − 5/8 log(3/8),
In this instance, the desired variable is 1.
Entropy is calculated using the following formula:
With p=5 and n=8, we obtain
A = -(5/8 log(5/8) + 3/8 log(3/8)) = Entropy
27. Age, gender, and blood cholesterol levels are the three risk factors we will use to forecast the likelihood of mortality from heart disease. What algorithm is best suitable in this situation?
Select the appropriate response:
Rational Regression
Regular Regression
Apriori K-means clustering algorithm
A , logistic regression, is the most suited algorithm in this situation.
28. After examining a population's behaviour, you have discovered four distinct individual categories that are useful to your research. You want to locate every user who most closely resembles each specific kind. Which algorithm is best for this research?
Select the appropriate response:
K-means grouping
Association for linear regression rules
A decision tree
It indicates the value of k because we're explicitly aiming to group people together based on four different similarities. Therefore, the best approach for this study is K-means clustering (response A).
29. After applying the association rules algorithm to your dataset, it was determined that the two rules "an apple, banana" and "an apple, orange" both lead to "grape" were pertinent. What else is a given?
Pick the proper response:
The items "banana, apple, grape, and orange" must be often used.
"Apple, banana" => Orange must be an applicable rule.
{grape} => Apple, banana must be a pertinent rule.
Grape and apple must appear frequently in itemsets.
The solution is A: Grape and apple must appear frequently in itemsets.
30. Visitors to your company's website receive one of two coupons at random. Additionally, it's probable that website visitors won't get a voucher. You must ascertain whether giving website users a coupon has any effect on their purchasing choices. Which analysis technique ought you employ?
Single-way ANOVA
K-means grouping
Rule of association
t-test for students
The solution is A, one-way ANOVA.
31. What are the true positive rate and false positive rate, respectively?
The probability that a true positive will really turn out to be true is defined by the True Positive Rate (TPR).
By dividing the number of "True Positives" by the sum of "True Positives" and "False Negatives," one can determine the True Positive Rate (TPR).
The formula for that is as follows:
TPR=TP/TP+FN
The likelihood that an actual negative result will be presented as a positive one, or the likelihood that a model will produce a false alarm, is defined by the False Positive Rate (FPR).
By dividing the number of false positives (FP) by the sum of true positives (TP) and false positives (FP), the false positive rate (FPR) is determined.
Below is the formula for the same:
FPR=FP/TN+FP
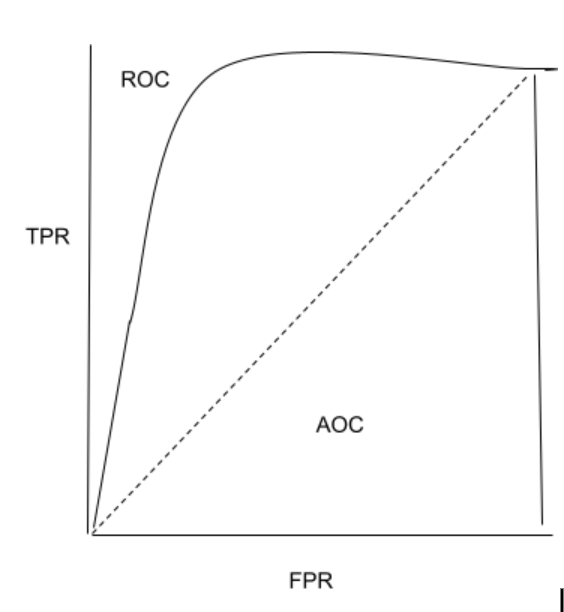
32. What does ROC stand for?
The ROC curve, which is used in binary classification, is a graph with the True Positive Rate on the y-axis and the False Positive Rate on the x-axis.
The ratio of False Positives to all Negative Samples is used to compute the False Positive Rate (FPR), and the ratio of True Positives to all Positive Samples is used to obtain the True Positive Rate (TPR).
The TPR and FPR readings are plotted on various threshold values in order to generate the ROC curve. The ROC curve's area under the curve has a range from 0 to 1. A straight line is used to illustrate a model that is entirely random and has a 0.5 ROC. The degree to which a ROC deviates from this line indicates how effective the model is.
33. Describe the Confusion Matrix.
The summary of the results of a certain problem's predictions is the confusion matrix. It is a table that is used to summarise the model's performance. The Confusion Matrix, a n*n matrix, assesses how well the categorization model performs.
34.
What are the true-positive rate and false-positive rate, respectively?
TRUE-POSITIVE RATE: The true-positive rate indicates how many of the positive class's forecasts were accurate. The percentage of actual positives that are accurately verified is also calculated using this metric.
FALSE-POSITIVE RATE: The percentage of inaccurate predictions made for the positive class is shown by the false-positive rate. When something is initially erroneous, a false positive makes the determination that it is true.
35. What distinguishes data science from conventional application programming?
The fundamental distinction between standard application programming and data science is that traditional programming requires the creation of rules to convert the input to output. The rules are generated automatically from the data in data science.
36. What makes long format data different from wide format data?
LONG FORMAT DATA: The first column's values are repeated. Each row in this arrangement represents a single point for each subject.
WIDE FORMAT DATA: In the Wide Format Data, each response can be recorded in a separate column but the repeated responses will all be in a single row.
Long Format Table:
|
NAME |
ATTRIBUTE |
VALUE |
|
RAMA |
HEIGHT |
182 |
|
SITA |
HEIGHT |
160 |
Wide Format Table:
|
NAME |
HEIGHT |
|
RAMA |
182 |
|
SITA |
160 |
37. Mention a few sample strategies. What is sampling's main benefit?
Sampling is the process of choosing specific individuals or a small portion of the population to gauge the characteristics of the entire population. Probability and Non-Probability Sampling are the two types of sampling.
38.
Why does Data Cleaning in DS employ Python?
Technical analysts and data scientists must transform a vast volume of data into useful ones. Malicious entries, outliners, incorrect values, unnecessary formatting, etc. are all removed during data cleaning. The most popular Python data cleaners include Matplotlib, Pandas, and others.
39. What are some of the most widely used libraries in data science?
Popular data science libraries include
Flow Tensor
Pandas
NumPy
SciPy
Scrapy
Librosa
MatPlotLib
40. What does data science variance mean?
Variance is the measure of how each individual figure in a set of data differs from the mean value and shows how they are distributed around the mean. Data scientists utilise variance to comprehend a data set's distribution.
41. What does the decision tree algorithm's pruning step entail?
Pruning is a machine learning and data science technique that is connected to decision trees. Pruning reduces the number of rules in the decision tree, simplifying it. Pruning increases accuracy and helps to avoid complexity. The various types of pruning include cost complexity pruning, reduced error pruning, etc.
42. What does the decision tree algorithm's entropy mean?
The measure of randomness or disorder in a group of observations is called entropy. It also controls the data-splitting switches in a decision tree. Entropy is also used to determine whether the provided data is homogeneous. The sample of data is completely homogeneous if the entropy is zero, and the sample is equally divided if the entropy is one.
43. What data are obtained with a decision tree algorithm?
Entropy is supposed to decrease, resulting in information gain. Gaining knowledge determines how the tree is constructed. The decision tree gets wiser thanks to the information gained. Parent node R and a set E of K training instances are included in the information gained. It computes the entropy difference between the splits before and after states.
44.
K-fold cross-validation: What is it?
The k-fold cross-validation method is used to gauge how well the model performs with fresh data. Every observation from the original dataset may show up in both the training and testing sets when using k-fold cross validation. The accuracy is estimated using K-fold cross-validation, however, it does not assist you to increase the accuracy.
45. What is a normal distribution?
The Gaussian Distribution is another name for the normal distribution. The data close to the mean and their frequency are displayed by the normal distribution. A bell curve is what the normal distribution looks like when it is visualised graphically. The normal distribution's properties include Mean, Standard Deviation, Median, and others.
46.
What is Deep Learning, exactly?
One of the key components of data science, including statistics, is deep learning. Deep Learning improves our ability to communicate effectively with and understand the human brain. Sincere efforts have been made to make the algorithms mimic the human brain. Multiple layers are created from the raw input in deep learning to extract the top-level layer with the best features.
47. RNNs (recurrent neural networks): what are they?
An algorithm called RNN makes advantage of sequential data. RNN is utilised in voice recognition, language translation, image capture, etc. RNN networks come in a variety of forms, including one-to-one, one-to-many, many-to-one, and many-to-many. Both Apple's Siri and Google's Voice search employ RNN.
48. What do feature vectors look like?
An n-dimensional vector of numerical features used to represent an item is known as a feature vector. In machine learning, feature vectors are used to mathematically express numerical or symbolic qualities of an object in a form that is simple to understand.
49. What steps go into creating a decision tree?
- Use the complete collection of data as your input.
- Find a split that maximises the classes' separation. Any test that divides the data into two sets is a split.
- Split the input data using the split (divide step).
- Apply the initial two procedures once more to the divided data.
- When any of the halting requirements are met, stop.
- Pruning refers to this process. If your splits go too far, clean up the tree.
50. Root cause analysis: what is it?
Although it was primarily created to examine industrial accidents, root cause analysis is now frequently utilised in various contexts. It is a method for identifying the underlying causes of errors or issues. If removing an element from the problem-fault-sequence prevents the ultimate unwanted event from happening again, that factor is said to be the root cause.
51.
How does logistic regression work?
The logit model is another name for logistic regression. With the help of a linear combination of predictor variables, it is a method for predicting the binary outcome.
52. What are Recommender systems?
A subclass of information filtering systems called recommender systems aims to forecast the preferences or ratings that a user would assign to a product.
54.
What is cross-validation?
A model validation approach called cross-validation is used to assess how well the results of a statistical investigation will generalise to a different data set. It is primarily employed when forecasting is the goal and one wants to determine how accurate a model will be in actual use.
Cross-validation aims to limit issues like overfitting and acquire an understanding of how the model will generalise to an independent data set by using a data set to test the model during the training phase (i.e. validation data set).
55. Collaborative filtering: what is it?
This filtering method is used by the majority of recommender systems to discover patterns and information using a variety of views, data sources, and agents.
56.
Do approaches using gradient descent always reach the same conclusions?
They don't because occasionally they come to a local minimum or local maximum. The global optimum point would not be attained. The information and the initial circumstances determine this.
57.
What does A/B testing aim to achieve?
For randomised trials involving the two variables A and B, statistical hypothesis testing is being done. A/B testing's goal is to identify any adjustments that may be made to a web page to optimise or improve the results of a strategy.
58. What shortcomings does the linear model have?
- The linearity of the errors presumption
- It cannot be used for binary or count results.
- There are issues with overfitting that it cannot resolve.
59. The law of huge numbers is what?
It is a theorem that explains what happens when you repeat an experiment a lot. The idea of frequency-style thinking is based on this theory. The sample means, sample variance, and sample standard deviation are said to converge to the estimate.
60.
What factors cause confounding effects?
These are superfluous variables in a statistical model that have correlations with both the dependent and independent variables, either directly or inversely. The confounding factor is not taken into account in the estimate.
61. Describe star schema.
It has a central table and follows a conventional database schema. Satellite tables, also known as lookup tables, are most helpful in real-time applications because they save a significant amount of memory. They link IDs to physical names or descriptions and can be connected to the central fact table via the ID fields. In order to recover information more quickly, star schemas occasionally use multiple summarization levels.
62. How often does an algorithm need to be updated?
An algorithm has to be updated when:
- In order for the model to change as data flows via the infrastructure,
- The source of the underlying data is evolving.
- There is a non-stationarity instance.
63. What are Eigenvalue and eigenvector?
The orientations that a specific linear transformation flips, compresses, or stretches are known as its eigenvalues.
For understanding linear transformations, use eigenvectors. In data analysis, the eigenvectors of a correlation or covariance matrix are typically calculated.
63. Why is sampling repeated?
All of the following situations involve resampling:
- Using accessible subsets of data to estimate the accuracy of sample statistics, or selecting randomly with replacement from a set of data points
- Labels on data points are replaced when significance tests are run
- Utilizing random subsets to validate models (bootstrapping, cross-validation)
64. What is bias in selection?
In general, selection bias is a problematic circumstance where a mistake is created because of a non-random population sample.
65. What kinds of biases are possible during sampling?
Selection bias
Undercoverage bias
Survivorship bias
66. What is bias against survivors?
The logical fallacy of focusing on factors that help a process survive while carelessly ignoring those that did not because they were less important is known as "survival bias." This may result in a variety of incorrect conclusions.
67. How does one approach a random forest?
This method's fundamental idea is that a powerful learner can be created by combining numerous weak ones. The involved actions are:
- Create a number of decision trees using bootstrapped training sample data.
- Out of all pp predictors, a random sample of mm predictors is selected as split candidates on each tree whenever a split is taken into account.
- As a general rule: Every split, m=pm=p
- Predictions: Using the majority rule
68.
What is a bias-variance trade-off?
Bias: Bias is a mistake in our model that results from an oversimplification of a machine learning algorithm. In an effort to make target functions simpler and easier to comprehend, this can cause an issue with underfitting and may result in oversimplified assumptions during model training.
Popular machine learning methods that score favourably for bias include the following:
Decision trees, K-Nearest Neighbors, and Support Vector Machines (SVM).
Those algorithms with a high bias score
both linear and logistic regression.
Variance: A model performs very poorly on a test data set due to a complicated machine learning technique that learns even noise from the training data set. Variance is the name of the error that happens in machine learning models that can lead to overfitting and hypersensitivity.
We attempt to make the machine learning algorithm more complex while attempting to overcome bias in our model. Although it aids in bias reduction, it eventually leads to overfitting of the model, which leads to hypersensitivity and excessive variance.
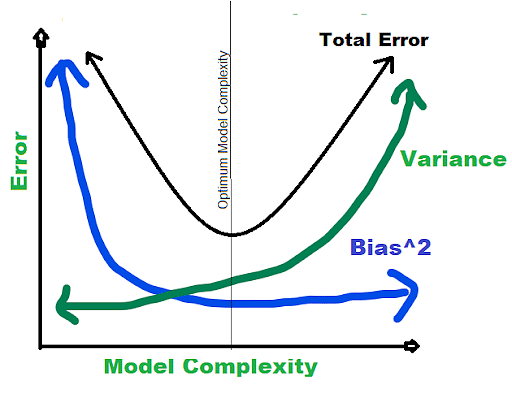
The basic goal of a supervised machine learning algorithm is to have minimal variance and bias in order to obtain the greatest performance.
The following observations are made about several of the well-known machine learning algorithms:
The Support Vector Machine (SVM) algorithm has a low bias and large variance. We can increase the parameter C to alter the trade-off. The C parameter alters the number of margin breaches that are permitted in training datasets, which increases bias and decreases variance.
Unlike the SVM, the K-Nearest Neighbors (KNN) Machine Learning method has a large variance and low bias. By raising the K value, which also raises the model bias, we can alter the algorithm's trade-off by boosting the prediction's ability to influence its nearby predictions.
69. What are Markov chains like?
According to Markov Chains, a state's future propensity solely depends on its present state.
Markov chains are within the category of stochastic processes.
The Markov Chains, whose output relies on their current state, are described in detail in the picture below.
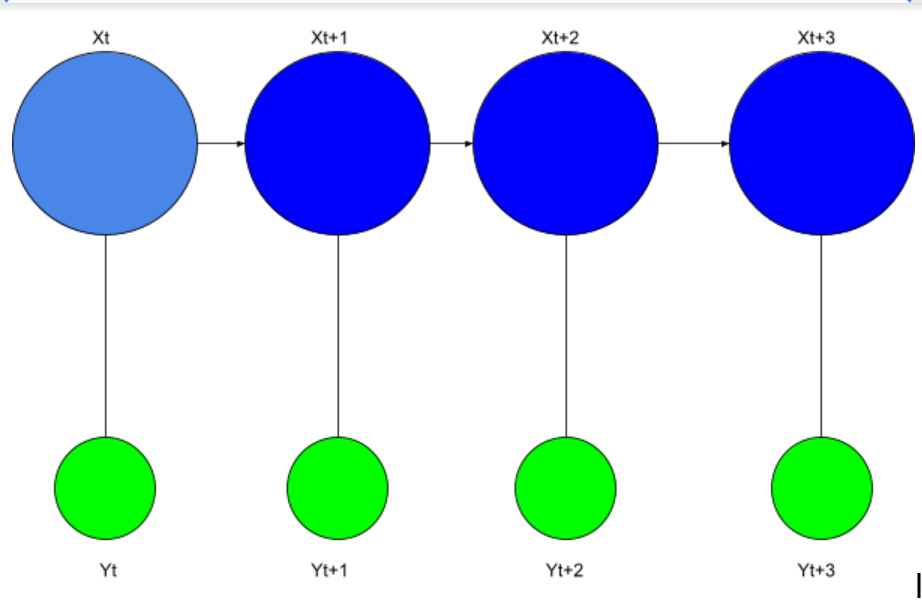
The word suggestion algorithm is a prime example of a Markov Chain. In this system, the model only recognises and suggests the following word based on the word that came right before it. Based on the previous word, the Markov Chains create suggestions for the current paragraphs using the prior paragraphs that were comparable to training data sets.
70. Why does data visualisation using R?
For the following reasons, R is frequently used in data visualisations:
- R allows us to make practically any type of graph.
- Lattice, ggplot2, Leaflet, and other libraries are just a few of the many built-in functions in R.
- In comparison to Python, R makes it simpler to personalise graphics.
- R is used for both exploratory data analysis and feature engineering.
71.
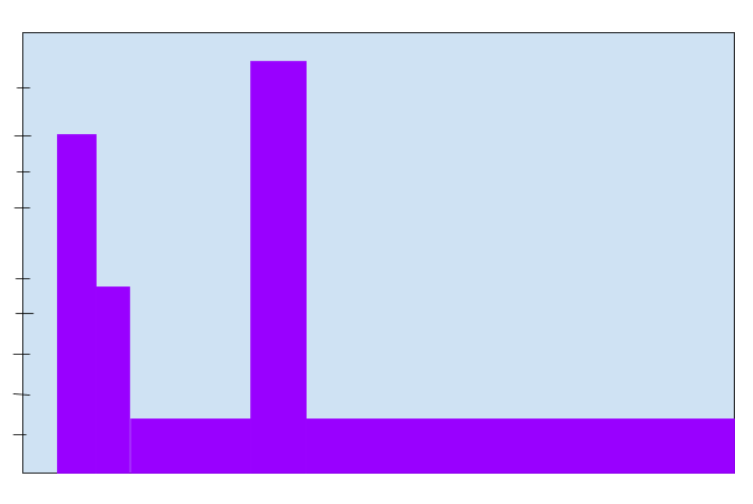
What distinguishes a box plot from a histogram?
Both box plots provide a visual representation of the frequency of a certain feature's values.
both histograms and.
Boxplots take up less area and have less information than histograms, making them more frequently employed when comparing many datasets. To learn about and comprehend the probability distribution underlying a dataset, histograms are utilised.
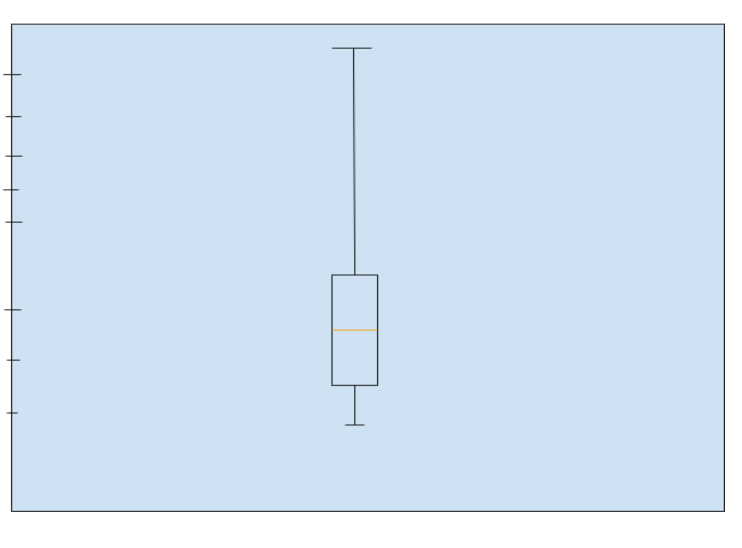
The image above shows a dataset's boxplot.
72. NLP stands for what?
The term "natural language processing" (NLP) is used. It examines how computers use programming to learn a vast amount of textual information. Stemming, Sentimental Analysis, Tokenization, the elimination of stop words, and other common NLP techniques are a few instances.
73. Difference between a residual error and an error
The distinction between an error and a residual error is defined as follows:
Error |
Residual Error |
|
The difference between the actual value and the predicted value is called an error. Some of the popular means of calculating data science errors are -
|
The difference between the arithmetic mean of a group of values and the observed group of values is called a residual error. |
|
An error is generally unobservable. |
A residual error can be represented using a graph. |
|
A residual error is used to show how the sample population data and the observed data differ from each other. |
An error is how actual population data and observed data differ from each other. |
74. What Separates Normalization from Standardization
Standardization |
Normalization |
|
|
|
|
X’ = (X - Xmin) / (Xmax - Xmin) Here, Xmin - feature’s minimum value, Xmax - feature’s maximum value. |
X’ = (X - 𝞵) / 𝞼 |
75. Point estimates and confidence intervals differ from one another.
The confidence interval provides a range of values that most likely contain the population parameter. It even reveals the likelihood that the population parameter can be found in that specific period. The probability or likeness is represented by the Confidence Coefficient (or Confidence level), which is indicated by 1-alpha. The significance level is indicated by alpha.
Point Estimates: A specific value known as the point estimate provides an estimate of the population parameter. The Maximum Likelihood estimator and the Method of Moments are two common techniques used to produce Population Parameters Point estimators.
In summary, the bias and variance are inversely correlated, meaning that as the bias increases, the variance decreases while the variance increases, and vice versa.
Questions for an individual interview in data science
Which machine learning algorithm is your favourite, and why?
Which do you think is the most crucial trait of a successful data scientist?
Why do you believe data science is so well-liked right now?
Describe the most difficult data science project you have ever worked on.
Which method of project work do you typically prefer—working alone, in a small team, or with a large group?
Tell me about your top five forecasts for the next ten years based on your experience in the sector.
What special abilities can you as a data scientist provide to the team?
Have you always worked in the field of data science? If not, what prompted the shift and how did you improve your skills?


